AK FlowBook: futures volume and the order book on one chart
Delta, big trades, icebergs, volume-profile levels, VWAPs and the exchange order book order by order, built for gold futures. We are showing every part of it here and on Instagram before release.
Join the waitlist: DM "FLOWBOOK" Follow the build on Telegram Free: FlowBook Lite for TradingView
Watch: every part explained
Every part of AK FlowBook for NinjaTrader explained on one real gold session (US jobs report, Oct 2 2026): delta, big trades, icebergs, volume-profile levels, VWAPs, session levels, event labels, the MBO price map and the context panel.
- 0:00 Intro
- 0:32 What AK FlowBook reads
- 1:00 Presets and sensitivity
- 1:31 Delta on every candle
- 2:10 Candle volume filters
- 2:41 Big trades, rebuilt from ticks
- 3:23 Icebergs
- 3:57 Volume-profile levels
- 4:33 VWAPs and bands
- 5:06 Session levels
- 5:39 Order-flow event labels
- 6:16 MBO price map
- 6:46 Market context panel
- 7:26 Putting it together
- 8:05 Versions and next steps
English subtitles on screen.
Why the full version runs on NinjaTrader
An indicator can only show what its data contains. TradingView gives scripts Level 1 data: price and volume bars. That is enough for levels such as VWAP and the value area, but buyers versus sellers can only be estimated, and the order book is invisible. On NinjaTrader with a futures feed, AK FlowBook reads every trade with its aggressor and every order in the book (market by order). That is why the full AK FlowBook lives on NinjaTrader, and why it is far more precise.
| FlowBook Lite · TradingView | FlowBook Full · TradingView | AK FlowBook · NinjaTrader | |
|---|---|---|---|
| Data it can read | Level 1: price and volume bars | Level 1: price and volume bars | Level 1 + 2 + 3: every trade, the book and every order |
| Volume-profile levels and VWAPs | Yes (from bars) | Yes (from bars) | Yes (exact volume at price) |
| Delta (buyers vs sellers) | Estimated (~) | Estimated (~) | Exact: each trade's aggressor from the exchange |
| Setup tool | — | Marks where several conditions line up at a level, with reference risk levels. Decisions stay yours. | Order-flow event labels and market context panel |
| Divergence and pattern markers | CVD~ divergence | More: price/volume divergence, 3-drive patterns | Real order-flow events: absorption, sweep, trap, exhaustion… |
| Review and alerts | Context alerts | Setup review (how past marked setups played out) + more alerts | Delta and volume alerts |
| Big trades | Large volume bars only (~) | Large volume bars only (~) | Real parent orders rebuilt tick by tick |
| Icebergs and the order book | Not possible | Not possible | Detected order by order, live order map |
| Platform | TradingView, any plan | TradingView, invite-only | NinjaTrader 8 with a futures data feed (market by order) |
| Price | Free for followers | Paid (coming) | Coming soon |
Both TradingView versions use the same Level 1 data; the Full version adds tools on top of it. Education only: no version tells you what to trade.
Chart of the day
Every trading day we redraw the most active part of the gold session the way AK FlowBook shows it, from our own futures and order-book data.
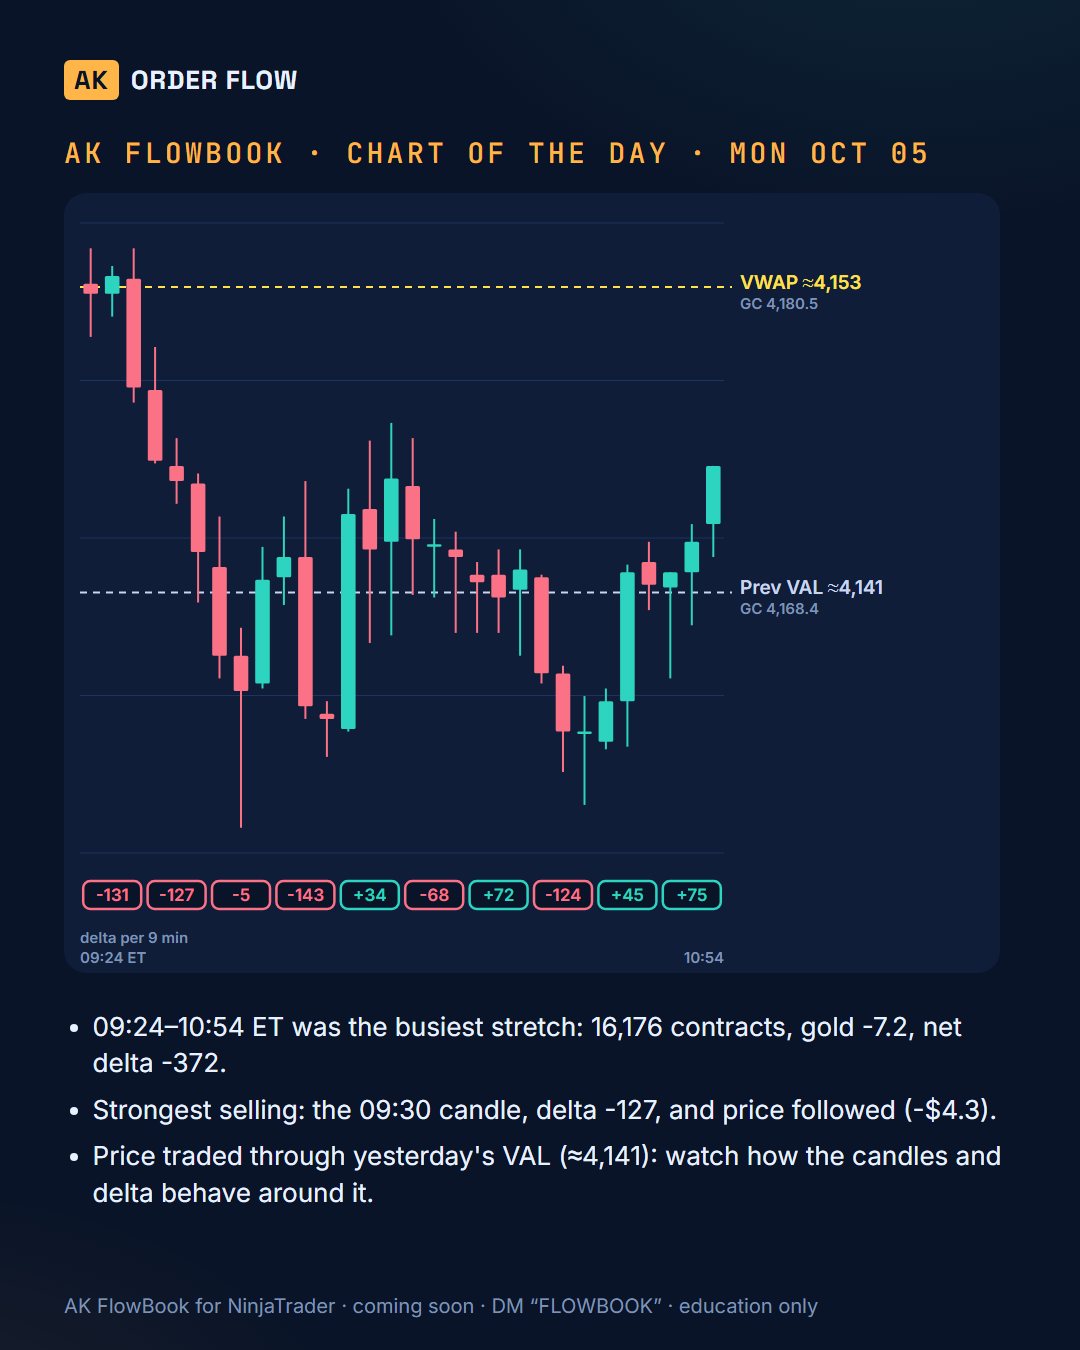
09:24–10:54 ET was the busiest stretch: 16,176 contracts, gold -7.2, net delta -372. Strongest selling: the 09:30 candle, delta -127, and price followed (-$4.3). Price traded through yesterday's VAL (≈4,141): watch how the candles and delta behave around it.
Every part, explained
Twelve parts, one per week on Instagram, all collected here. Graphics are redrawn from real gold futures data; prices on charts come with XAUUSD equivalents.
One chart, everything in place
What it shows: Futures candles, delta, big trades, icebergs, volume-profile levels, VWAPs and the exchange order book, drawn together on a NinjaTrader 8 chart.
How to read it: Start from the levels, then read what trades there: who was aggressive, who absorbed, and how price answered.
Why it matters: Order flow only means something at a place that matters. Seeing both on one chart removes the guesswork.
Delta on every candle
What it shows: The aggressive buy volume minus the aggressive sell volume of each candle, as a number under it, coloured by side.
How to read it: Large delta with little price movement means someone absorbed it; small delta with a big move means the book was thin.
Why it matters: Delta shows who was urgent. Price shows whether that urgency worked.
Big trades, rebuilt from ticks
What it shows: Single large aggressive orders, reassembled from the many prints they split into, shown as one marker with the size. A smart view tags how price reacted: FAIL, FLIP, DRIVE, EDGE, LARGE.
How to read it: A big buyer that price follows is a DRIVE; one that gets absorbed is a FAIL; one that price turns against is a FLIP. EDGE means it happened at an important level.
Why it matters: Big players leave footprints. What price does after them is the real information.
Icebergs
What it shows: Hidden orders that show a small size in the book but keep refilling, with the real traded size and whether the level held or broke.
How to read it: A hidden buyer under price that keeps absorbing sellers is support with a name on it. When it breaks, the level often flips role.
Why it matters: The order book lies about size; the trades do not. Icebergs are where that difference shows.
Candle volume filters
What it shows: Significant aggressive volume inside each candle in five colour tiers, sells on the left and buys on the right.
How to read it: Clusters of the strongest tiers at the top or bottom of a move show where the fight happened inside the candle.
Why it matters: A candle hides where its volume traded. The filters open it up without a full footprint chart.
Volume-profile levels
What it shows: Daily, weekly and monthly POC, value-area high and low (developing, previous and naked), high- and low-volume nodes, merged neatly on the right edge.
How to read it: Value edges are where acceptance or rejection is decided; naked POCs are untested magnets.
Why it matters: These are the levels the whole market traded most, not lines drawn by hand.
VWAPs and bands
What it shows: Daily, weekly and monthly VWAP with ±1σ and ±2σ bands, plus untouched previous VWAPs.
How to read it: Above VWAP buyers are in control of the period's average; the bands frame how stretched price is.
Why it matters: Institutions benchmark execution against VWAP, so it is often defended.
Session levels
What it shows: Asia, London and New York highs and lows, previous-day high and low, with how many times each was touched.
How to read it: Untouched session extremes attract price; heavily touched ones tend to give way.
Why it matters: Session extremes are where stops and fresh orders sit.
Order-flow event labels
What it shows: Short labels on the chart when order flow does something specific: rejection, sweep, absorption, exhaustion, trap, iceberg, liquidity vacuum and more, optionally only near important levels.
How to read it: Read them as observations, not instructions: what happened, where.
Why it matters: They turn a busy tape into a few readable moments.
MBO price map
What it shows: A map on the right side of the chart, aligned with price, showing the resting orders at each price split into individual orders, with walls, icebergs and level tags.
How to read it: Thick single orders are real intent; many small ones are crowd liquidity. Orders that vanish as price comes are pulled, not filled.
Why it matters: Market-by-order data shows every order, not just the total per price.
Market context panel
What it shows: A compact panel: data health, auction state, position versus value, nearest level, effort versus result, initial balance and value migration.
How to read it: One glance tells you whether the market is balancing or trending and where price sits.
Why it matters: Context decides how to read every event on the chart.
Putting it together
What it shows: One real gold session read top-down with every layer.
How to read it: Levels first, then context, then what order flow did at the level.
Why it matters: The tools only work together.
Questions
When is AK FlowBook released? It is in final testing on NinjaTrader 8. Join the waitlist (send FLOWBOOK to @akorderflow on Instagram) or follow the Telegram channel to hear first.
Which platform and data does it need? NinjaTrader 8 with a market-by-order (Level 3) futures data feed; it is built and tuned on gold futures (GC, MGC) and also supports ES, NQ and CL presets.
Is there a free version? Yes: AK FlowBook Lite for TradingView shows our VWAPs, value areas and naked POCs on your own chart. TradingView has no order-book data, so order flow there is estimated.
Does it give buy or sell signals? No. It shows what traded, where and how price answered. Decisions stay yours.
Education only. Not financial advice. Trading involves substantial risk of loss. NinjaTrader is a trademark of NinjaTrader Group, LLC; we are not affiliated.